H & S Real Estate Group
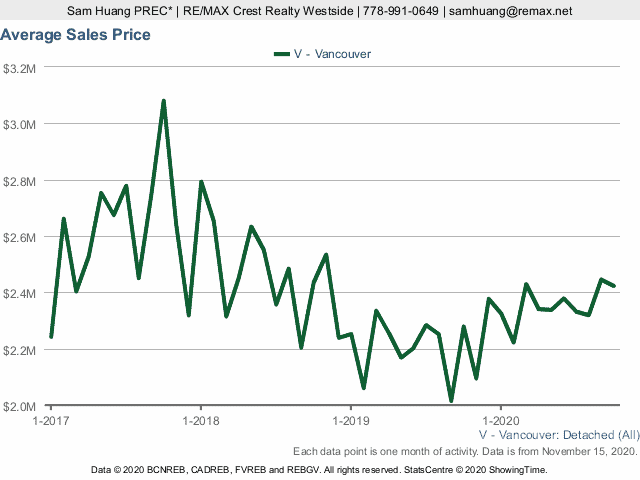
Table of Contents
Navigating the Vancouver real estate market feels like trying to predict the weather – constantly changing and often unpredictable. You’re looking to buy or sell a home, and you need to understand the trends, but where do you even begin? Sifting through endless news articles and scattered data points is overwhelming, and frankly, a waste of your valuable time.
That nagging uncertainty keeps you up at night. Are prices about to surge, or are they finally cooling down? Is now the right time to sell, or are you leaving money on the table? Every decision feels like a high-stakes gamble. You see your dream home listed, but hesitate, fearing you’ll overpay. You hear whispers of a market crash, and panic sets in. You’re bombarded with conflicting information, leaving you paralyzed and unable to make informed choices. The anxiety of potentially making the wrong move, of missing out on the perfect opportunity, or losing your hard-earned savings, is a heavy burden. You know that understanding the historical data is crucial, but piecing it together feels impossible, and the fear of making a costly mistake grows with each passing day.
Imagine having clear, concise, and visually compelling charts that break down Vancouver’s house price history. We’ve compiled essential data, including average sales prices, price per square foot, and total inventory, into easy-to-understand charts. This blog post provides you with the insights you need to make confident decisions. We’ll cut through the noise and give you a clear picture of the market’s past, empowering you to navigate the present and plan for your future in Vancouver real estate. Let’s turn that anxiety into informed action.
More like this:
Vancouver Real Estate Listings:

Sam Huang PREC
H & S Real Estate Group
Real Estate Coal Harbour
RE/MAX Select Properties
Address: 5487 West Boulevard, Vancouver BC V6M 3W5, Canada
Phone: 778-991-0649
WeChat: ubchomes
QQ: 2870029106
Email: Contact Me