Your Satisfaction Is My Top Priority

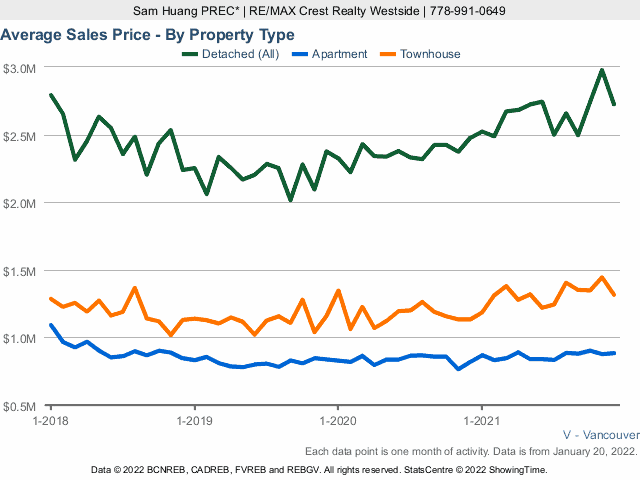
vancouver housing market

Vancouver Housing Market Update – 2023

Table of Contents

Vancouver House Prices by Neighbourhoods (2023)

The Vancouver housing market has experienced a seasonal slowdown as summer ends, influenced by rising borrowing costs. This slowdown has brought about cooling price gains and reduced sales, in line with the typical seasonal trend.

Amidst these changes, the Real Estate Board of Greater Vancouver (REBGV) reports that residential home sales in August 2023 reached 2,296, a 21.4% increase compared to the same month in 2022. However, this figure was 13.8% below the 10-year seasonal average, indicating a deviation from the norm. This fluctuation raises questions about the impact of higher borrowing costs on the housing market.

Despite the challenging economic environment with fluctuating borrowing costs reaching the highest levels in a decade, Metro Vancouver’s housing market has defied expectations. Year-to-date, the market has recorded over eight percent price gains across all home types. In August 2023, 3,943 properties were newly listed for sale, an 18.1% increase from the previous year, though still 5.3% below the 10-year average. Currently, there are 10,082 homes listed for sale, a slight decrease from the last year but still 13.4% below the 10-year average.

Analyzing the sales-to-active listings ratio, which stands at 23.9% for August 2023, shows that the market remains balanced. Detached homes have a ratio of 14.2%, townhomes at 30.3%, and apartments at 31.9%. Historically, a ratio below 12% exerts downward pressure on prices, while ratios above 20% indicate upward price pressure.

Andrew Lis, REBGV’s director of economics and data analytics, characterized the market as a “tortoise and hare” story, with slower sales at the beginning of the year but increasing prices due to low inventory. As fall approaches, sales and prices are slowing down, aligning with historical seasonal patterns.

The MLS® Home Price Index benchmark price for all residential properties in Metro Vancouver is $1,208,400, representing a 2.5% increase over August 2022. Sales of detached homes, apartments, and attached homes all saw positive growth compared to the previous year, with corresponding changes in benchmark prices.

In conclusion, the Vancouver housing market has demonstrated resilience in the face of rising borrowing costs, with prices and sales aligning with seasonal expectations. This data suggests a balanced and stable real estate market, offering valuable insights for prospective buyers and sellers in Metro Vancouver.

Vancouver West Neighbourhoods House Prices Charts

Arbutus Vancouver Average House Price Chart

Cambie Vancouver Average House Price Chart

Coal Harbour Vancouver Average House Price Chart

Downtown Vancouver Average House Price Chart

Dunbar Vancouver Average House Price Chart

Fairview Vancouver Average House Price Chart

False Creek Vancouver Average House Price Chart

Kerrisdale Vancouver Average House Price Chart

Kitsilano Vancouver Average House Price Chart

Mackenzie Heights Vancouver Average House Price Chart

Marpole Vancouver Average House Price Chart

Mount Pleasant Vancouver Average House Price Chart

Oakridge Vancouver Average House Price Chart

Point Grey Vancouver Average House Price Chart

Quilchena Vancouver Average House Price Chart

Shaughnessy Vancouver Average House Price Chart

South Cambie Vancouver Average House Price Chart

South Granville Vancouver Average House Price Chart

South West Marine Vancouver Average House Price Chart

Southlands Vancouver Average House Price Chart

UBC Vancouver Average House Price Chart

West End Vancouver Average House Price Chart

Yaletown Vancouver Average House Price Chart

Vancouver East Neighbourhoods House Prices Charts

Champlain Heights Vancouver Average House Price Chart

Collingwood Vancouver Average House Price Chart

Downtown Vancouver East Average House Price Chart

Fraser Vancouver Average House Price Chart

Fraserview Vancouver Average House Price Chart

Grandview Vancouver Average House Price Chart

Hastings Vancouver Average House Price Chart

Killarney Vancouver Average House Price Chart

Knight Vancouver Average House Price Chart

Main Vancouver Average House Price Chart

Mount Pleasant Vancouver Average House Price Chart

Renfrew Vancouver Average House Price Chart

Renfrew Heights Vancouver Average House Price Chart

South Vancouver Vancouver Average House Price Chart

Victoria Vancouver Average House Price Chart


More like this:

Greater Vancouver Real Estate Listings:
PHOTO CREDIT : Photography Manoeuvres

Sam Huang PREC
H & S Real Estate Group
Real Estate Coal Harbour
RE/MAX Select Properties
Address: 5487 West Boulevard, Vancouver BC V6M 3W5, Canada

Phone: 778-991-0649
WeChat: ubchomes
QQ: 2870029106
Email: Contact Me

© Copyright 2024 Real Estate Coal Harbour. All Rights Reserved