Table of Contents
Burnaby House Prices Charts – 2023
Burnaby MLS House Price Index (HPI) Chart – 2023
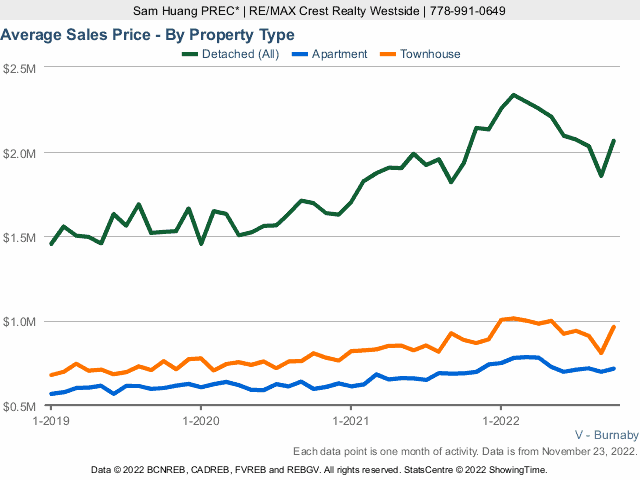
Burnaby Average House Sold Price
Burnaby Average House Sold Price as a Percent of Original Price – 2023
Burnaby Houses for Sale Average Listing to Contract Days
Burnaby Average House Sold Price Per Square Foot
Burnaby Houses for Sale Total Inventory
New Burnaby Houses for Sale Listings
Number of Burnaby House Sales
Burnaby Detached House Sales to Active Listings Ratio
Burnaby Townhouse Prices Charts – 2023
Burnaby MLS Townhouse Price Index (HPI) Chart – 2023
Burnaby Average Townhouse Sold Price
Burnaby Average Townhouse Sold Price as a Percent of Original Price – 2023
Burnaby Townhouses for Sale Average Listing to Contract Days
Burnaby Average Townhouse Sold Price Per Square Foot
Burnaby Townhouses for Sale Total Inventory
New Burnaby Townhouses for Sale Listings
Number of Burnaby Townhouse Sales
Burnaby Townhouse Sales to Active Listings Ratio
Burnaby Condo Prices Charts – 2023
Burnaby MLS Condo Price Index (HPI) Chart – 2023
Burnaby Average Condo Sold Price
Burnaby Average Condo Sold Price as a Percent of Original Price – 2023
Burnaby Condos for Sale Average Listing to Contract Days
Burnaby Average Condo Sold Price Per Square Foot
Burnaby Condos for Sale Total Inventory
New Burnaby Condos for Sale Listings
Number of Burnaby Condo Sales
Burnaby Condo Sales to Active Listings Ratio
More like this:
- Vancouver Condo Prices Chart
- Vancouver Housing Market
- East Vancouver House Price History Chart
- Vancouver House Price History Chart
- How much are Penthouses in Vancouver?
- West Vancouver Real Estate Prices Chart
- Coal Harbour Condo Prices Chart
- False Creek & Olympic Village Condo Prices Chart
- West End Vancouver Home Prices Chart
- Yaletown Vancouver Home Prices Chart
- Downtown Vancouver Home Prices Chart
Real Estate Listings: