H & S Real Estate Group
The Real Estate Board of Greater Vancouver (REBGV) is a realtor association with more than 14,000 Realtors who live and work in cities from Whistler to Tsawwassen and everywhere in between.
GVREB also regularly publishes Vancouver real estate statistics.
Table of Contents
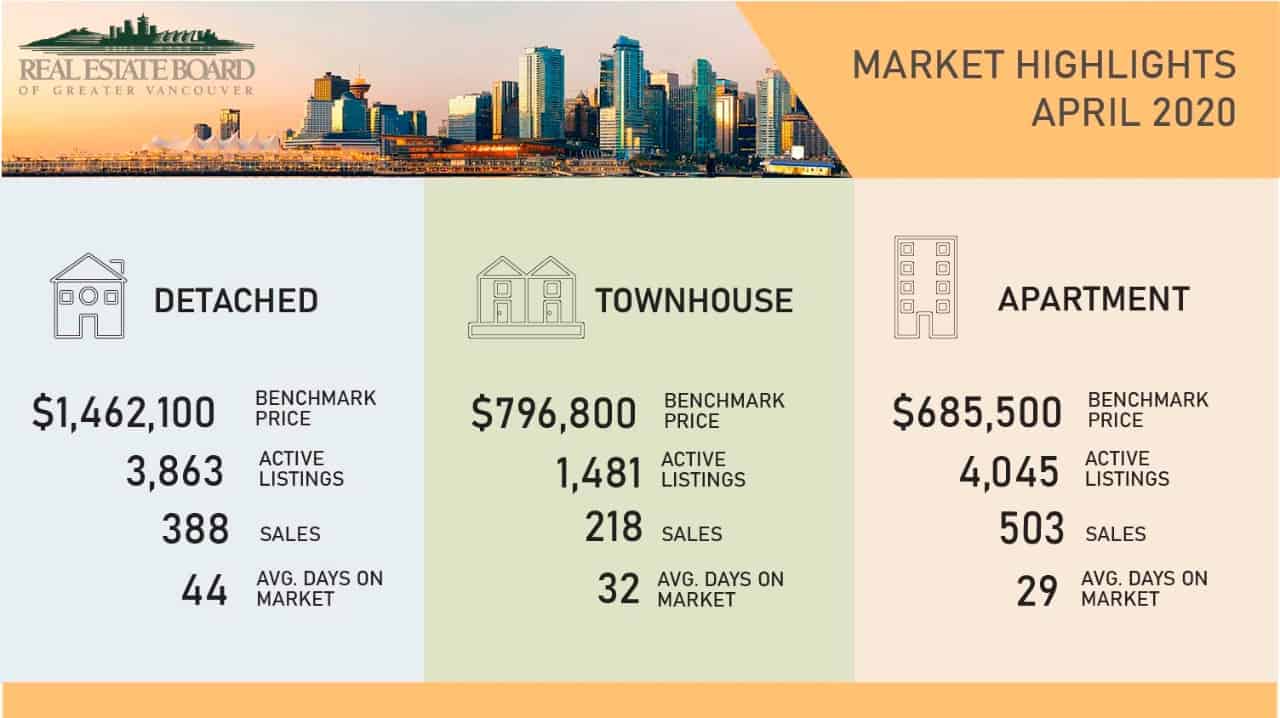
Vancouver housing market consists of three smaller housing markets based on the property type: Detached Houses, Townhouses, and Apartments/Condos.
Generally, analysts say downward pressure on home prices occurs when the ratio dips below 12 percent for a sustained period. In comparison, home prices often experience upward pressure when it surpasses 20 percent over several months.
The supply and demand are very different for each of the property types. Below you will find important Vancouver real estate stats. If you have any questions about the stats in this blog, please contact me.
More like this:
Vancouver Real Estate Listings:
Sam Huang PREC
H & S Real Estate Group
Real Estate Coal Harbour
RE/MAX Select Properties
Address: 5487 West Boulevard, Vancouver BC V6M 3W5, Canada
Phone: 778-991-0649
WeChat: ubchomes
QQ: 2870029106
Email: Contact Me