H & S Real Estate Group

Are you a home seller tracking home sales in the Vancouver real estate market, only to watch some sit for weeks while others sell in mere days? You keep seeing the mysterious acronym Days on Market (DOM) on listings. Still, you’re unsure exactly what that number truly means for your selling timeline.
In a market as competitive and fast-paced as Vancouver real estate, a single number—the DOM—holds significant power, and misunderstanding it can cost you thousands. If you’re a home buyer, a high DOM might make you wonder, “Is there something wrong with this house?” You risk overlooking a great deal or, conversely, wasting time on a “stale” property. If you’re a home seller, watching your DOM tick up past the neighbourhood average is a source of crushing anxiety. Every extra day on the market erodes buyer interest, strengthens their negotiation leverage, and forces you to confront the very real possibility of a price reduction. Furthermore, the confusion over how relisting affects the DOM versus the “true” time on the market means you might not have the complete, accurate picture—and without that picture, you’re making critical financial decisions in the dark.
Stop guessing and start negotiating with confidence. In this post, we’re going to demystify “Days on Market” (DOM) in Vancouver real estate. You will learn the exact definition of DOM, how it reflects the health of the market (from a “Seller’s Market” to a “Buyer’s Market”), and most importantly, how to use it—along with the crucial “Cumulative Days on Market” (CDOM)—as a powerful negotiating tool, whether you are buying your first home or strategizing the sale of your current property. Read on to master this critical metric in Vancouver home transactions.
Table of Contents
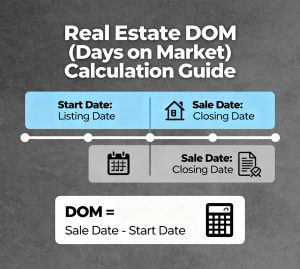
DOM measures the time a property has been listed on the MLS.
CDOM measures the total time a property has been available across all listings.
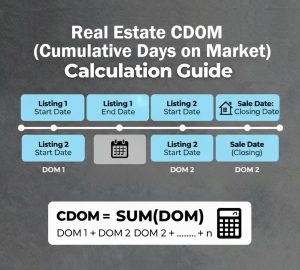
CDOM provides a more accurate indication of the total time it took to sell the property.
Days on Market is typically visible on public listing websites. However, Cumulative Days on Market is usually found only within the official MLS system. Sellers can access this crucial data by consulting with their real estate agent. While neither statistic is inherently “better,” together they provide a more accurate and complete representation of the property’s time on the market.
The average Days on Market is often significantly different across property types—condo, townhouse, and detached home—even within the same market area (like Vancouver West). This difference is primarily driven by three factors: price point, buyer pool size, and market liquidity (demand vs. supply).
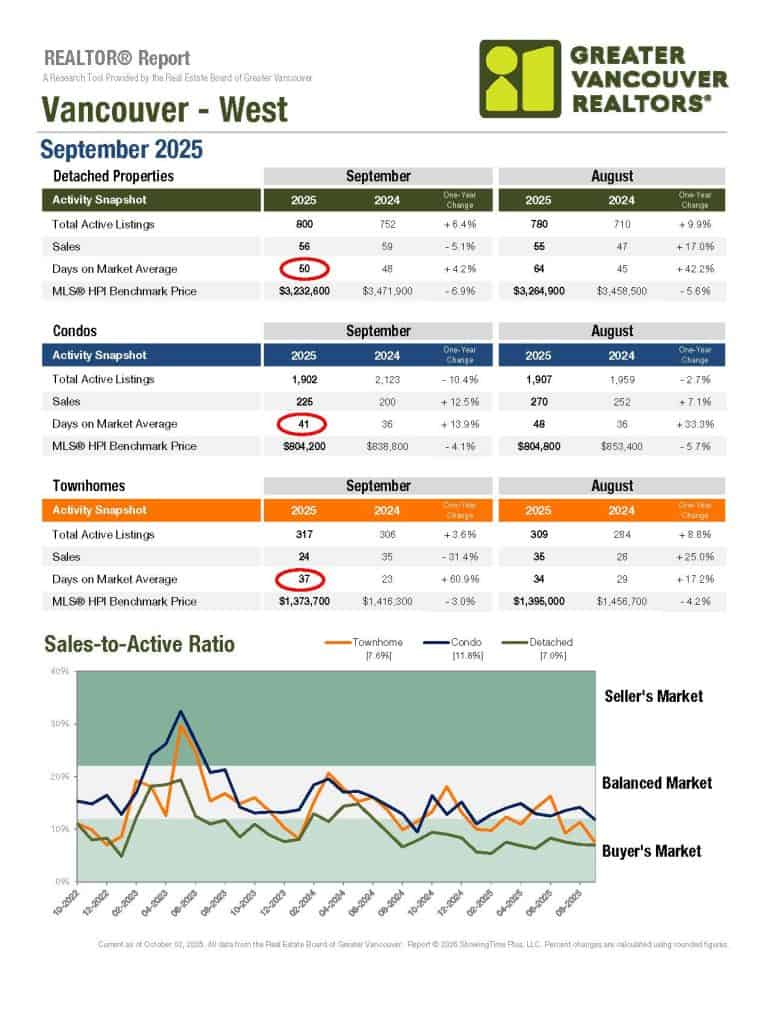
Using September 2025 Vancouver West data as an example, here is why the DOM varies:
In summary, the lower the average price point and the higher the demand-to-supply ratio for a specific property type, the lower the DOM is expected to be.
The table below shows 2025 year-to-date sales data for Vancouver West Detached Houses. There is a clear and direct relationship between the price point and both Days on Market and Cumulative Days on Market.
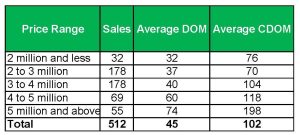
Source: MLS
As the price range increases, the average time a property spends on the market (DOM) and the total time it takes to sell (CDOM) both increase significantly.
The DOM effectively more than doubles (from 32 days to 74 days) as you move from the lowest price bracket to the highest.
The CDOM demonstrates the most dramatic change, increasing by over 260% (from 76 days to 198 days) between the lowest and highest brackets. This highlights the true selling struggle in the luxury segment.
Conclusion: For Vancouver West detached homes, the data confirms that liquidity decreases as the price point increases. High-end homes require significantly more time and strategic pricing adjustments to sell, as reflected by their dramatically higher DOM and CDOM figures.
How Vancouver West Neighbourhoods Impact DOM and CDOM
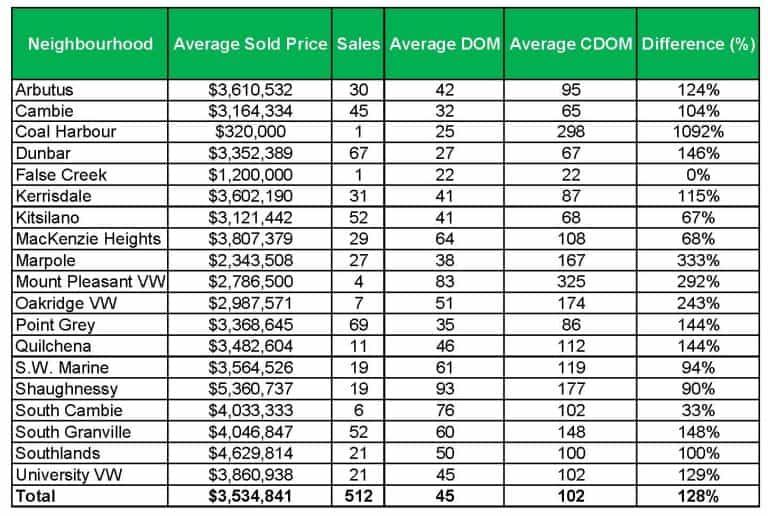
Source: MLS
The attached table clearly demonstrates that the location (Neighbourhood) is a critical factor influencing both the average time a detached house takes to sell (DOM) and the total time required (CDOM). Market velocity and seller expectations differ wildly across Vancouver West.
1. Low DOM / High Velocity Neighbourhoods (Fast Sellers)
Neighbourhoods with a low average DOM indicate high, sustained demand, good market liquidity, and likely more realistic pricing.
| Neighbourhood | Avg DOM | Avg CDOM | Interpretation |
|---|---|---|---|
| False Creek | 22 | 22 | Fastest sales. Likely limited inventory, combined with high desirability or a high volume of properties sold immediately upon listing. |
| Dunbar | 27 | 67 | Speedy initial sales (DOM 27 days). The relatively small difference to CDOM suggests high market confidence and effective initial pricing. |
| Cambie | 32 | 65 | Strong demand, with homes moving quickly once listed. A classic “hot” neighbourhood for detached homes. |
| Point Grey | 35 | 86 | Excellent performance for a high-value area. High desirability keeps the time-to-sale low. |
2. High DOM / Low Velocity Neighbourhoods (Slower Sellers)
Neighbourhoods with a high average DOM suggest either a smaller buyer pool, overly ambitious pricing, or a market segment that requires more time for buyers to secure financing for expensive properties.
| Neighbourhood | Avg DOM | Avg CDOM | Interpretation |
|---|---|---|---|
| Shaughnessy | 93 | 177 | The high Average DOM confirms that properties sit longer due to their ultra-luxury price point, limiting the pool of qualified buyers. The very high Average CDOM indicates significant price resistance, suggesting that sellers frequently remove listings from the market and relist them to achieve a desired sale price. |
| Mount Pleasant VW | 83 | 325 | The highest DOM indicates significant sales struggles. Buyers are hesitant, or prices are highly mismatched to expectations. The massive 292% difference in CDOM confirms a history of multiple relistings and price corrections. |
| South Cambie | 76 | 102 | High initial DOM suggests properties are sitting unsold. However, the relatively small 33% difference in CDOM indicates that, once listed, the properties don’t undergo as many relistings, suggesting that sellers set the price correctly. |
| MacKenzie Heights | 64 | 108 | This area’s higher price point of $3.8M contributes to the longer DOM, reflecting the smaller pool of high-net-worth buyers. |
3. The CDOM Discrepancy (Relisting Activity)
The Difference (%) column highlights which neighbourhoods have the most “stale” inventory being relisted to reset the DOM clock.
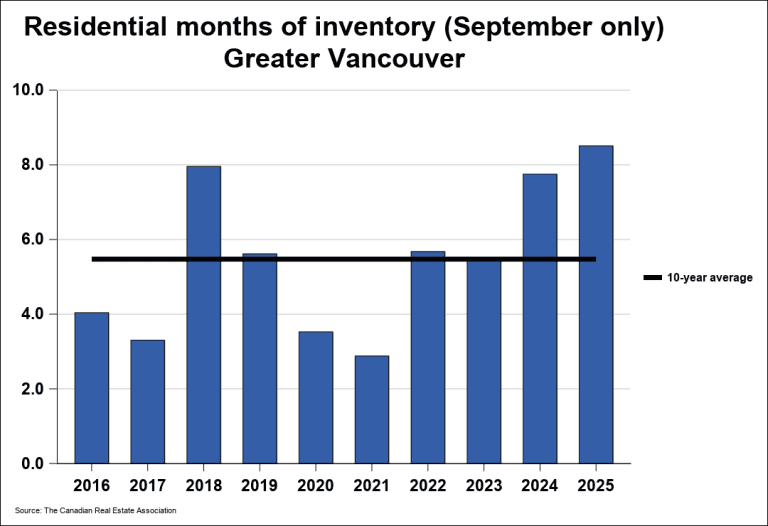
Source: MLS
Another influential driver of DOM and CDOM in Greater Vancouver is the region’s growing real estate inventory and rising months of inventory. In September 2025, the number of MLS listings jumped to 17,079—a 14.4% increase over September 2024 (14,932) and 36.1% higher than the 10-year seasonal average (12,553).
When months of inventory rise above the 10-year average of 5.5 months—as seen in September 2025 (8.5 months) and 2024 (7.8 months)—the market shifts further in favour of buyers. With more homes available, buyers have a wider selection and are less pressured to act quickly or bid aggressively. They can compare listings, negotiate harder, and wait for price drops. Consequently, sellers experience longer delays before receiving offers, and properties tend to remain on the market for extended periods. This elevated supply leads directly to higher Days on Market and Cumulative Days on Market, reflecting the increased competition among sellers and slower overall market pace.
Property condition and presentation are critical drivers of Days on Market. Homes that are move-in ready, professionally staged, thoroughly cleaned, have attractive curb appeal, and feature high-quality listing photos attract immediate buyer interest, often resulting in multiple offers and a low DOM. Conversely, homes requiring significant repairs, poor maintenance, or clutter are perceived as problematic. Buyers factor in renovation costs and hassle, often leading to few viewings, low-ball offers, and a significantly higher DOM as the property lingers and becomes “stale.”
Based on the attached tables (Vancouver West Detached Sales by Price Range and Neighbourhood) and the accompanying statistics, Days on Market (DOM) provides several critical insights into the dynamics of the Vancouver real estate market:
Understanding Days on Market (DOM) and Cumulative Days on Market (CDOM) is vital for success in the competitive Vancouver market. These metrics reveal market velocity, buyer interest, and hidden seller strategies based on price and location. Don’t let these crucial numbers remain a mystery; use them to refine your pricing strategy or strengthen your negotiation.
Ready to use this data for your next move? Contact your local realtor, Sam Huang, if you have any other questions about DOM or CDOM insights specific to your neighbourhood.

Sam Huang PREC
H & S Real Estate Group
Real Estate Coal Harbour
RE/MAX Select Properties
Address: 5487 West Boulevard, Vancouver BC V6M 3W5, Canada
Phone: 778-991-0649
WeChat: ubchomes
QQ: 2870029106
Email: Contact Me